
Topics Covered
What is ANOVA?
Analysis of Variance (ANOVA) is a statistical method in Maths used to compare the means of three or more samples to determine if at least one sample mean is significantly different from the others. It helps in identifying whether the differences among the means are due to actual variation or random chance.
ANOVA Formula
The general formula for ANOVA is:
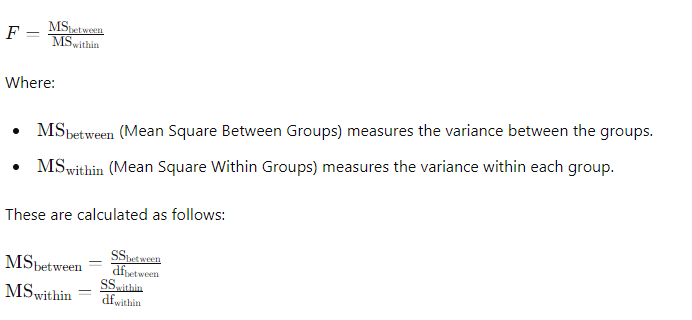
Where:
- SSbetween is the Sum of Squares Between Groups.
- SSwithin is the Sum of Squares Within Groups.
- dfbetween is the degrees of freedom between groups.
- dfwithin is the degrees of freedom within groups
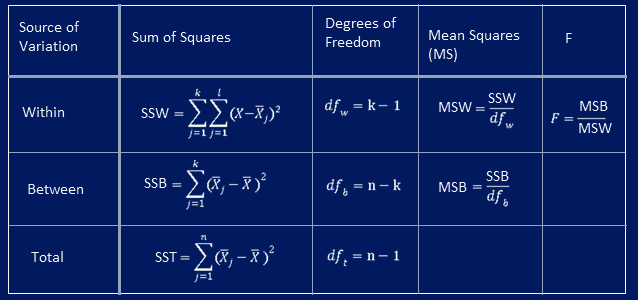
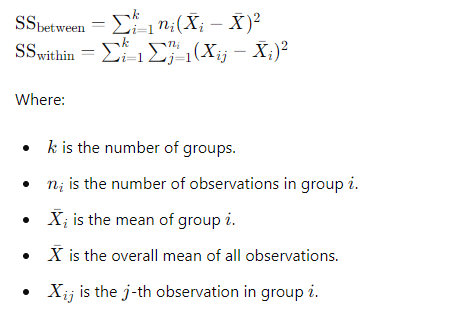
Calculating Sum of Squares – ANOVA Formula
ANOVA Formula – Example
Suppose we want to compare the test scores of students from three different teaching methods. The scores are:
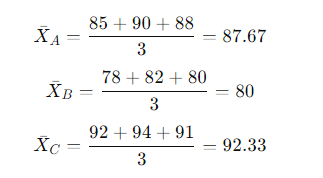
- Method A: 85, 90, 88
- Method B: 78, 82, 80
- Method C: 92, 94, 91
- Calculate Group Means:
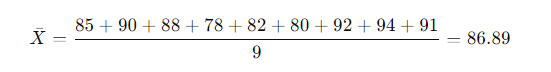
- Calculate Overall Mean:
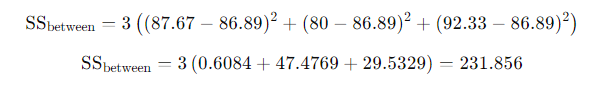
- Calculate Sum of Squares Between (SSB):
- Calculate Sum of Squares Within (SSW):

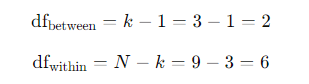
- Calculate Degrees of Freedom:
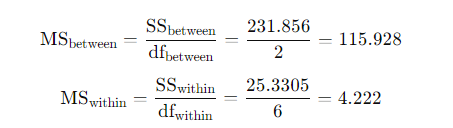
- Calculate Mean Squares:
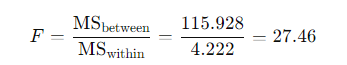
- Calculate F-statistic:
ANOVA Formula – Frequently Asked Questions
Q1: What is the purpose of ANOVA?
A1: The purpose of ANOVA is to determine if there are statistically significant differences between the means of three or more independent groups.
Q2: When should I use ANOVA?
A2: ANOVA is used when comparing the means of three or more groups to see if at least one group mean is different from the others. It is especially useful when conducting experiments or comparing different conditions or treatments.
Q3: What are the assumptions of ANOVA?
A3: The assumptions of ANOVA are:
- Independence of observations.
- Homogeneity of variances (equal variances among groups).
- Normally distributed populations.
Q4: What is the difference between one-way and two-way ANOVA?
A4: One-way ANOVA compares the means of three or more groups based on one factor, while two-way ANOVA compares the means based on two factors, which can also examine the interaction between these factors.
Q5: What is the F-statistic in ANOVA?
A5: The F-statistic in ANOVA is the ratio of the variance between the group means to the variance within the groups. A higher F-statistic indicates a greater likelihood that the observed differences between group means are significant.
Q6: How do you interpret the p-value in ANOVA?
A6: The p-value in ANOVA indicates the probability that the observed differences between group means occurred by chance. A p-value less than the significance level (usually 0.05) suggests that there are significant differences between the group means.
Q7: Can ANOVA be used for non-parametric data?
A7: For non-parametric data, ANOVA is not appropriate. Instead, non-parametric alternatives like the Kruskal-Wallis test can be used.
Q8: What is a post-hoc test in ANOVA?
A8: A post-hoc test is conducted after ANOVA if significant differences are found. It helps to determine which specific groups’ means are different from each other. Common post-hoc tests include Tukey’s HSD, Bonferroni, and Scheffé’s test.
This content provides a comprehensive understanding of ANOVA, including its formula, calculation steps, example, and frequently asked questions, making it a useful guide for anyone studying or applying ANOVA.